Sunday, December 7, 2008

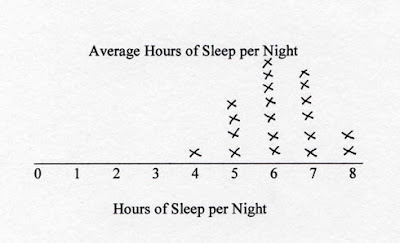
Stem and leaf plot


A stem-and-leaf plot is a display that organizes data to show its shape and distribution. This plot map shows the average hours of sleep per night, over hours of sleep per night. This person is getting a nice amount of sleep, averaging around 6 hours per night. Although, it does vary depending on age and amount of physical activity during the day. It is reported that teenages and young adults need around 8 hours of sleep per night but they typically do not get it, especially college students. This map would be more useful if it provided the information of the person or people that were involved in giving the information.

URL:http://www.qacps.k12.md.us/cms/sci/tools/MATHTBX.HTM

Box plot

This box plot was taken from the Michelson-Morley Experiment. This was one of the most important experiments in the history of physics.

URL:http://en.wikipedia.org/wiki/Box_plot

Histogram


A histogram is a graphical display of tabulated frequencies, shown through the use of a bar graph. This particular graph is a horizontal way of viewing the histogram. It is a graph of a jockey team and I believe the numbers are the various scores and statistics of their season. It is important to realize that GIS and mapping span across all different types of professions, hobbies and entertainment aspects of life, because they can be useful and make time more efficient.

URL:http://www.daisy2000.com/Daisy2003/horizontalhistogram.html

Parallel coordinate graph


parallel coordinate graph is used to plot large sets of data. This is convenient for people using various different variable and factors that are equating to the desired outcome. I suppose this may be efficient for a scientist who has a control and different tests to see if the hypothesis matches with the desired theories.

URL:http://raffy.ch/blog/2007/03/

Triangular plot

Triangle plots also are very self explanatory, in the fact that they show information and plot this data in a triangular form. This map shows the votes of people based on the classification of themselves such as, liberal democrat, labour, and conservative. This is useful in politics and government dealings and issues.

URL:http://ex-parrot.com/~chris/wwwitter/200504.html

Windrose


wind rose is a graphic tool used by meteorologists to give a succinct view of 
how 
wind speed and direction are typically distributed. This windrose shows the speed in knots, which is the generic way to measure wind. This type of map would typically be useful for sailors or pilots.

URL:http://www.climate.washington.edu/climate.html

Climograph


climograph is a graphical depiction of the monthly precipitation and temperature conditions for a selected place. This map is of Walgett, Australia. One can see that this map not only provides statistical and weather related information, but it also provides cultural information. The temperature is given in Celsius, thus meaning that this map would be quite useless to an American who doesn't have access to a convertor or who has never dealt with Celsius before. It's interesting how maps give us clues to a country's culture, even without meaning to.

URL:http://www.uwsp.edu/geo/faculty/lemke/geog101/lecture_outlines/09_global_climate_patterns.html